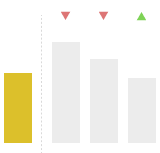
Category Comparison Bar Chart
This Power BI custom visual, the Category Comparison Bar Chart, includes features for detailed data analysis and comparison, such as tooltips, brushing, and analytics tools.
- The visual offers features like tooltips, brushing, and analytics tools.
Specifications
- Number of users
- 10 Users, 200 Users, 50 Users, 500 Users, Free Trial, Unlimited Users
How AI sees this product
The more complete this product's details, the more confidently AI assistants can understand and recommend it.
72%