If you sell internationally, you've probably felt this: a promo that prints money in one country can flop in another.
The product might be the same. The creative might be the same. The audience might even be the "same" on paper.
But pricing culture is not the same.
Some markets treat discounts like a steady background hum - always present, always expected. Others run fewer promos, but when they do, they go big. And even the "normal" way a price ends (like .99 vs .90 vs .00) changes by region.
This post breaks down what we're seeing in a scan of 1,300,000+ products across 100,000+ e‑commerce shops, with a focus on cross‑country/currency differences and how they compare to global averages.
The global baseline (what "normal" looks like overall)
Before we talk country-by-country, it helps to anchor on the global averages.
In our dataset:
- 16.18% of products are discounted right now
- 27.6% of discounted products are 50%+ off (what most shoppers would call a "real" sale)
- That means 4.47% of all products in the scan are 50%+ off at the time we captured the data
On price endings (the "charm pricing" question), globally:
- 66.93% of prices end in .00
- 14.65% end in .99
- 5.21% end in .95
- 1.53% end in .90
- 2.77% end in .50
- 8.92% end in something else ("weird endings" like .98, .75, .49, etc.)
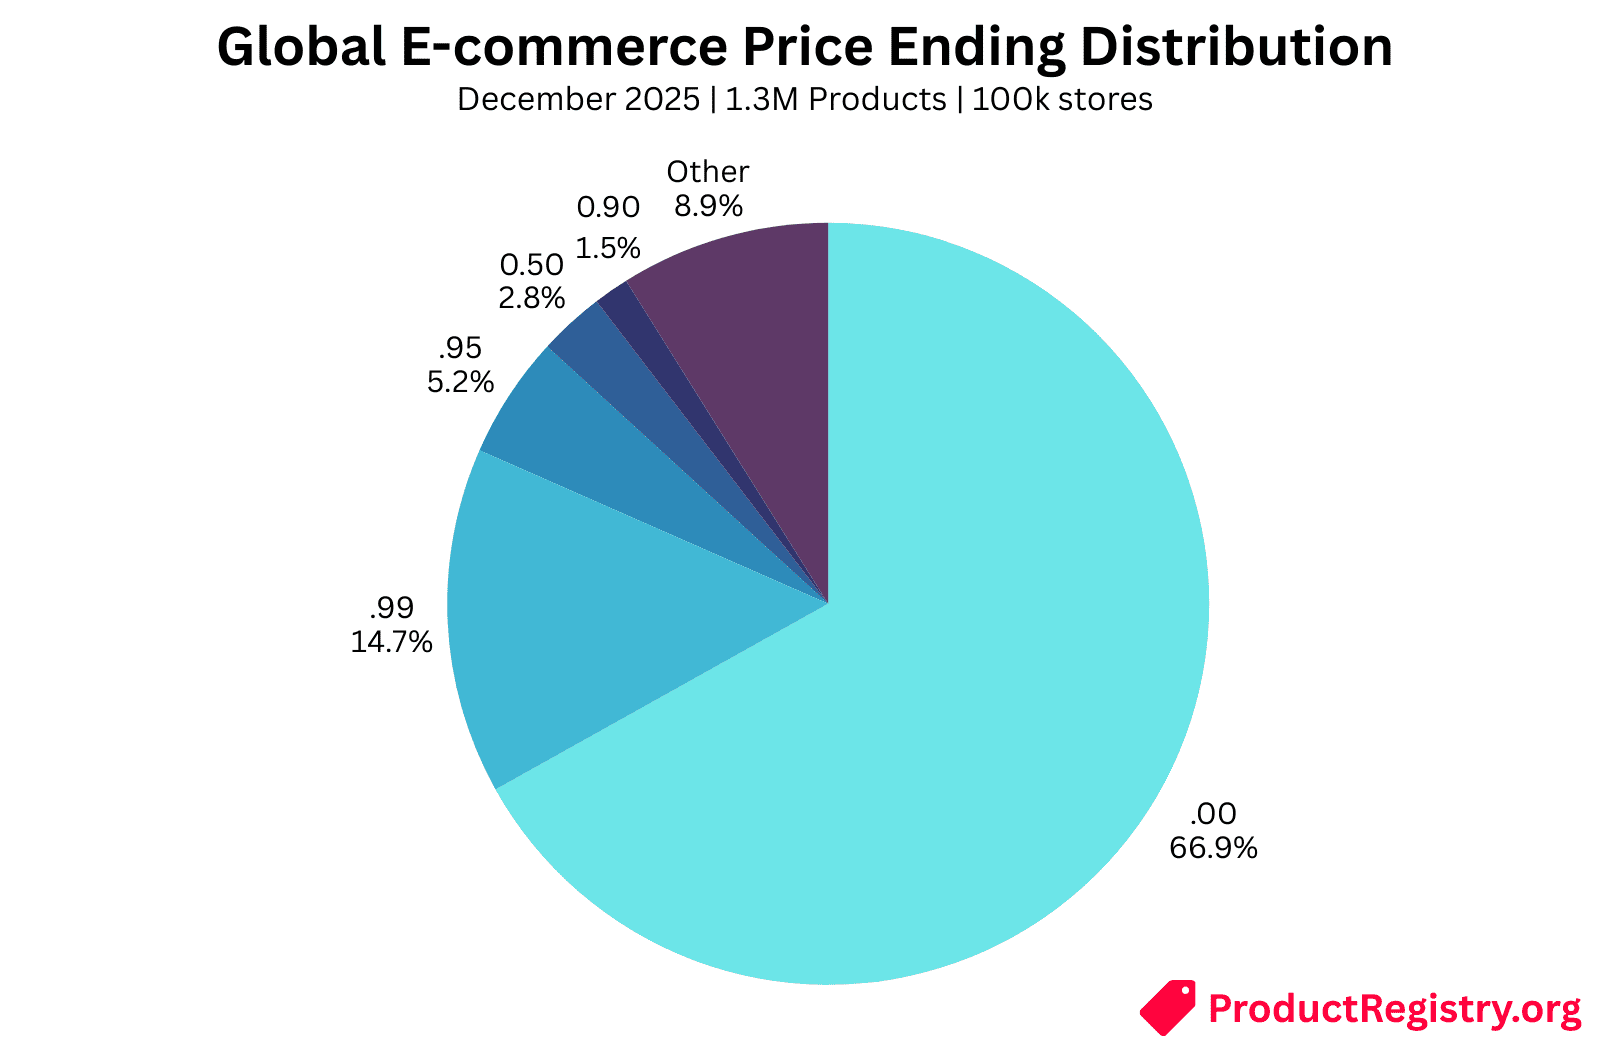
If you only sell in one market, you can miss how unusual that pattern is elsewhere. Globally, round prices dominate, and ".99 everywhere" is not a universal truth.
1. How often products are discounted varies wildly by market
Here's the first practical insight for global merchants:
"Discount frequency" is a market-level behavior. You can't assume your home market's promo cadence will feel normal abroad.
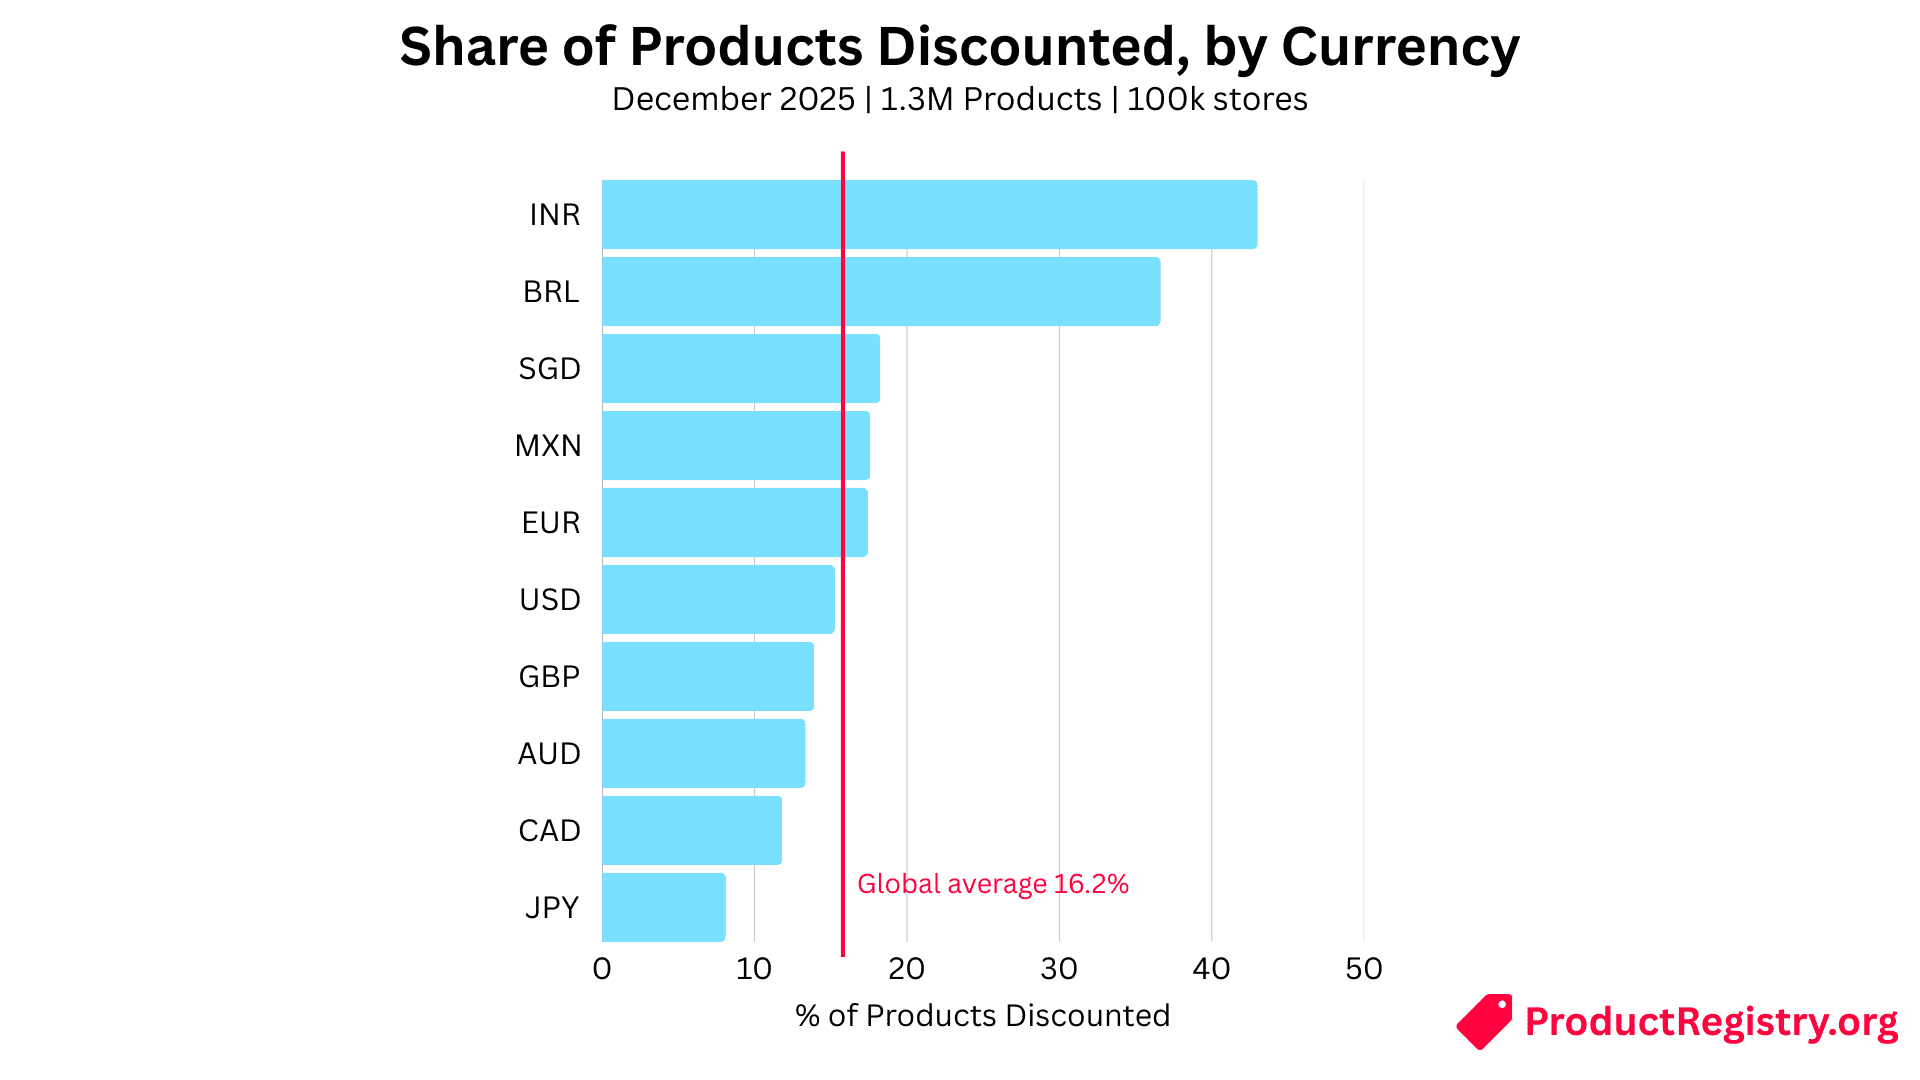
For major currencies in our dataset, the share of products discounted looks like this:
| Currency | % of Products Discounted |
|---|---|
| INR | 43.01% |
| BRL | 36.65% |
| EUR | 17.44% |
| MXN | 17.60% |
| SGD | 18.26% |
| USD | 15.27% |
| GBP | 13.93% |
| AUD | 13.35% |
| CAD | 11.82% |
| JPY | 8.11% |
Global average is 16.18%. So India (INR) is running at ~2.66× the global baseline, while Japan (JPY) sits at ~0.50×.
What this means in plain terms:
- In promo-heavy markets, shoppers often expect to see markdowns. "10% off" can feel like background noise.
- In promo-light markets, constant discounts can read as suspicious or low-quality (or just unnecessary).
2. Not all discount cultures are "always on sale" - some are "rare, but massive"
Discount frequency is only half the story. The other half is discount depth.
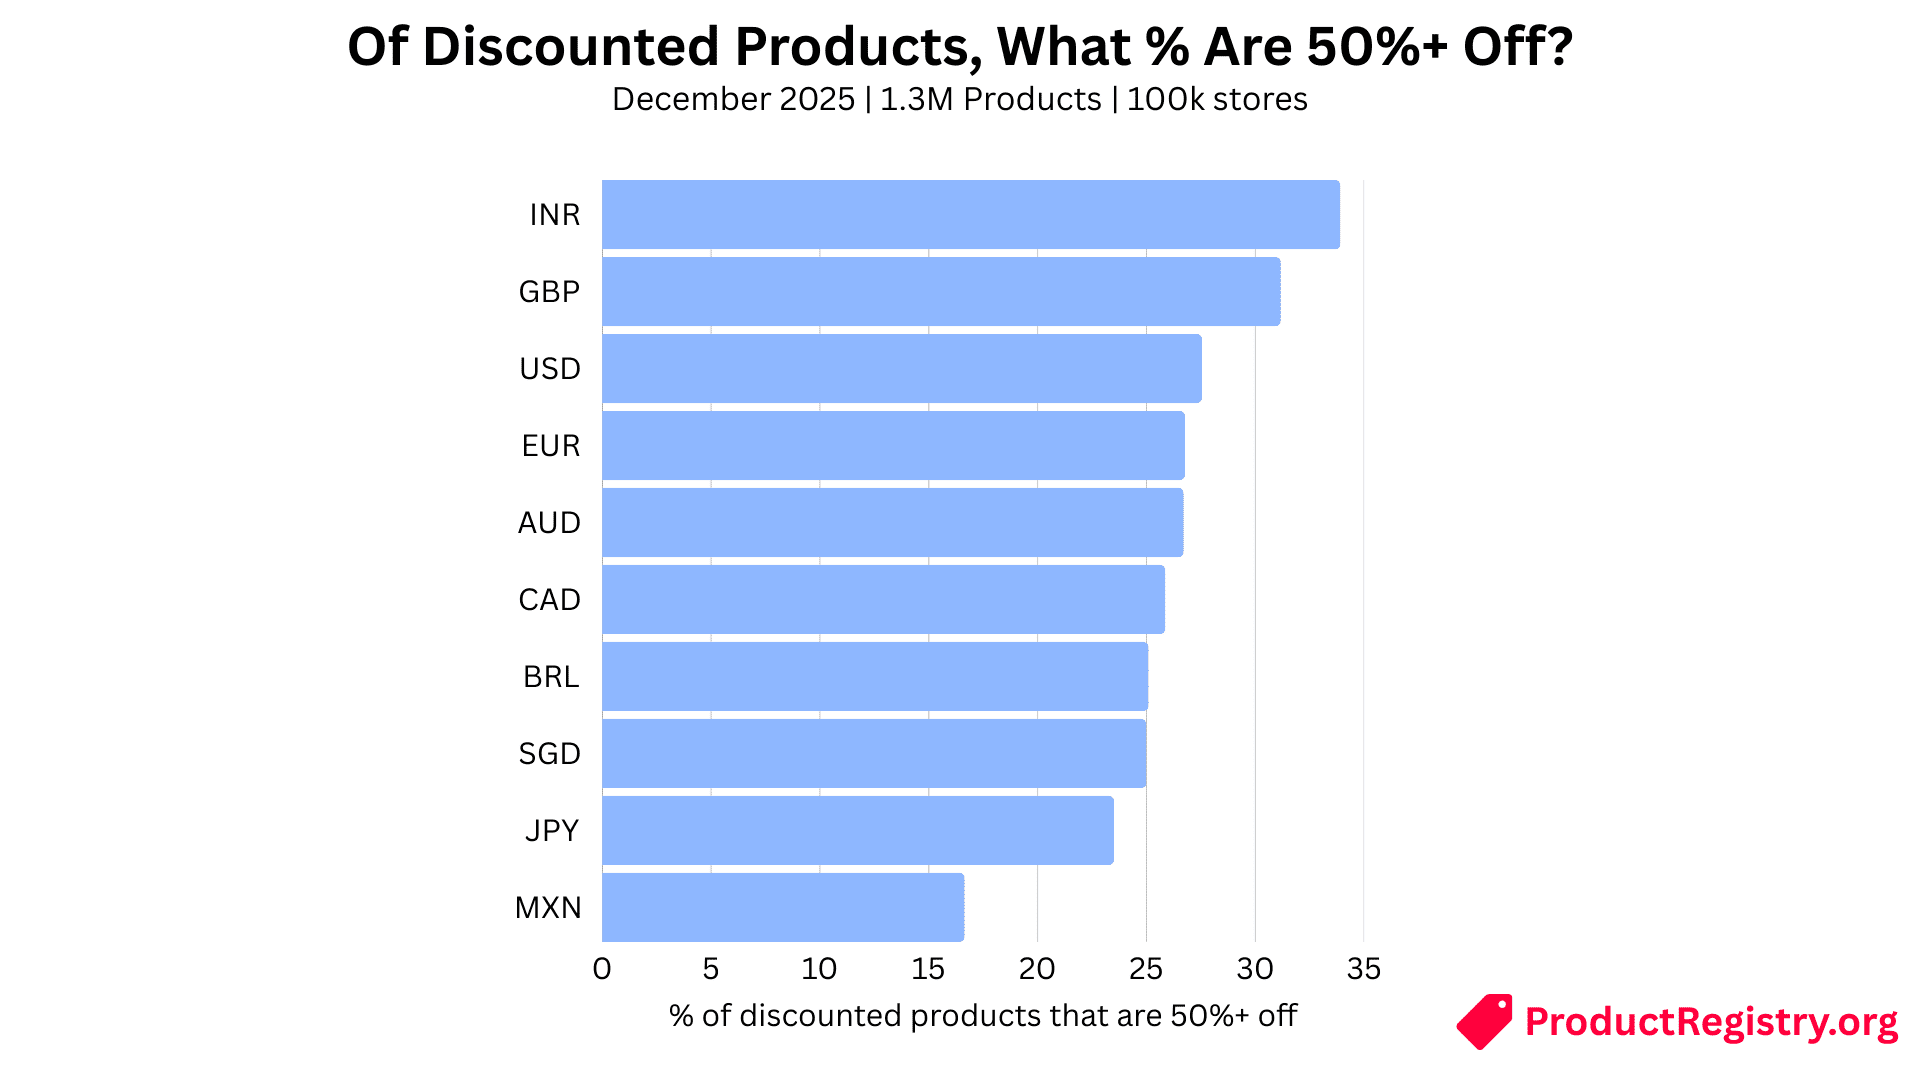
Across the whole dataset, 27.6% of discounted items are 50%+ off. That's the global "extreme sale" benchmark.
But by currency, the mix changes. Among the same major currencies:
| Currency | % of Discounted Products 50%+ Off |
|---|---|
| INR | 33.91% |
| GBP | 31.17% |
| USD | 27.55% |
| EUR | 26.77% |
| AUD | 26.71% |
| CAD | 25.87% |
| BRL | 25.10% |
| SGD | 25.00% |
| JPY | 23.51% |
| MXN | 16.65% |
This creates two very different "shopping atmospheres":
A. "Many discounts, and many are deep"
Example: INR A randomly sampled product has a surprisingly high chance of being 50%+ off:
- 14.59% of all INR-priced products in our scan are 50%+ off (vs 4.47% global).
B. "Discounts happen, but not as many are extreme"
Example: MXN Discount prevalence is near the EUR range, but extreme discounts are much less common.
Practical takeaway: If your global playbook is "run frequent promos everywhere," you may be under-discounting in some markets (where shoppers have learned to wait) and over-discounting in others (where it can erode trust and margin fast).
3. Price endings are local. ".99" is not the global default.
When merchants say "pricing psychology," they often mean charm pricing (.99, .95, .90). But the "right" charm ending is not the same everywhere.
Here are the dominant patterns we see:
North America & the UK: ".99 is the workhorse"
- USD: 17.11% end in .99; 65.09% end in .00
- CAD: 17.21% end in .99; 62.30% end in .00
- GBP: 18.86% end in .99; 56.17% end in .00
In these markets, .99 reads normal, and it's a clean signal of "retail pricing."
Eurozone + some Asia markets: ".90 is unusually common"
- EUR: 11.50% end in .90 (compared to 0.65% in USD)
- SGD: 12.34% end in .90
- BRL: 31.77% end in .90 (a standout)
If you copy-paste ".99 everywhere" into markets where .90 is the familiar charm, you risk looking slightly "imported" or out of step.
4. Charm pricing is strongest on cheaper items and fades fast as prices rise
Across the full dataset, the "ending strategy" changes sharply by price band.
In the lowest price band (0–20):
- 22.81% end in .99
- 14.52% have "weird endings"
- Only 46.85% end in .00
In the highest price band (2000+):
- 94.09% end in .00
- Only 1.32% end in .99
- "Weird endings" drop to 3.63%
This is intuitive if you've ever priced a product line:
- For low-ticket items, small psychological differences matter.
- For high-ticket items, many merchants go clean and round (and shoppers may prefer that).
5. The "ending" can hint at the kind of discount you're seeing
One of the more surprising findings shows up when we look at extreme discounts (50%+ off) by price ending.
Across all products with a given ending, the chance that the product is 50%+ off is:
- Ending in .90: 6.52% are 50%+ off
- Ending in .50: 6.41%
- Ending in "other": 6.03%
- Ending in .95: 5.82%
- Ending in .99: 5.69%
- Ending in .00: 3.75% (meaningfully lower)
This doesn't mean ".90 causes discounts." It's a pattern that suggests:
- .00 prices are more stable (and/or used more often on items that aren't aggressively discounted).
- .90 and .50 are over‑represented in big markdowns, consistent with a "was X.90, now Y.90" style of promo pricing.
A simple framework for global merchants: Two levers, different cultures
When you zoom out, most pricing "cultures" are pulling on two main levers:
- Discount pressure (how often items are discounted)
- Charm pressure (how often prices end in .99/.95/.90)
You can map markets on these two axes. For example:
- High discount, low charm: INR, PKR (discounting does the heavy lifting)
- Moderate discount, high charm: USD, GBP, EUR (ending strategy matters more)
- High discount, high charm: BRL (both levers are active)
- Low discount, low charm: JPY (clean, stable pricing)
What to do with this (actionable steps)
If you're expanding to new countries, here's a practical way to use these benchmarks without over-complicating your pricing.
1. Don't export your discount calendar - localize it
Before you decide promo cadence, look at the market baseline.
-
If you're entering a promo-heavy market (like INR in our dataset), plan to compete on:
- Clearer "was/now" messaging
- Bigger tentpole events
- Stronger everyday value (because shoppers may assume discounts are inflated).
-
If you're entering a promo-light market (like JPY in our dataset), consider:
- Fewer promos
- Cleaner pricing
- Stronger trust signals (shipping speed, warranty, returns)
2. Pick the "native" ending strategy before you test anything else
A fast win is simply not looking foreign.
- Selling into USD/GBP/CAD markets? Use .99 confidently.
- Selling into EUR/SGD/BRL markets? .90 (and .95) show up far more than many merchants expect.
- Selling into INR/MXN/JPY markets? .00 dominates; don't force .99 just because it worked at home.
3. Use charm pricing where it's strongest: lower price points
If your catalog has a wide range, don't apply one rule to everything.
- Under low price points, charm endings are common (and "weird" endings are common too).
- At higher price points, rounding is the norm.
4. Treat 50%+ discounts as a different product story
A 20% discount is "a deal." A 50% discount is "a clearance, a reset, or a seasonal dump."
If your market baseline has many 50%+ sales, your promos may need to be:
- less frequent but more meaningful, or
- clearly positioned (end-of-season, last chance, limited sizes, etc.)
If your baseline has fewer 50%+ sales, be careful: deep discounts can train shoppers fast.
Closing thought
Global growth isn't just a translation problem. It's a norms problem.
Pricing is one of the strongest "signals" your brand sends-often before someone reads a word of copy. If your prices look native and your promos match local expectations, everything else works better: ads, conversion, retention, even reviews.
If you want more benchmark posts like this (or you want to compare your own catalog against these baselines), Product Registry is building a neutral dataset and tooling to make global product marketing more measurable.